[account_shop_links]
The Industry Standard Research CRO Benchmarking reports contain service provider experiences and perspectives from recent users in the biopharmaceutical sphere. This information can inform sponsor organizations to make more educated CRO selections for their Phase I, II, and III studies. Additionally, this information can bolster your marketing strategy to position your CRO to stand out from competitors. In the previous article, which looked at the associations and correlations between variables that may relate to CRO preference, we determined that familiarity, previous use of, and perceived leadership are strongly associated with preference.
Here we analyze these select, associated factors to try to better understand and explain what most influences CRO preference – that is, why do respondents prefer a certain CRO over others? (And yes, we ask them directly which CRO they prefer if the choice were entirely up to them.) How much does preference play into the CRO selection process?
Service provider selection: Driven by rational thought or emotion?
Rational Choice Theory posits that people do not randomly make choices but that we use logical decisions based on weighing the options, including cost and benefits, against each other1. On the other hand, behavioral studies show that preference does not often translate to behaviors (or use)2. We wanted to see if this theory held true with biopharmaceutical professionals. Are sponsors working with those CROs they prefer, or are there other factors involved that may preclude rational choice?
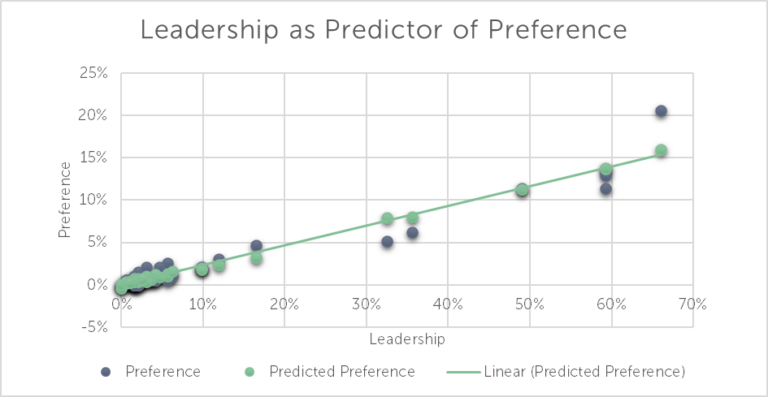
Using recent data from our Phase I CRO Benchmarking (15th edition), we included three variables – leadership, familiarity, and use – in a multiple regression to assess the association with CRO preference. A brief overview of linear regression: multiple linear regression is a statistical method that can show the explanatory power of multiple input variables on the target variable. The values of the variables are plotted against the expected values, given a relationship between the variables. In other words, if the variables did correlate with – or relate to – the other, we would see the strength and slope of that relationship in the regression line. Using Preference as our outcome (the target variable and the one we’re trying to predict) and Familiarity, Leadership, and Use as the input variables, the model R2 is 0.92 (p<0.05). This means that 92% of variation in Preference can be explained by Familiarity, Leadership, and Use. Looking at each individual variable, Leadership is the only one to have statistically significant explanatory power. (This means that the explanatory power – or influence – of leadership on preference is not due to random chance.) The coefficient for leadership is 0.22 (p<0.05). Note: Familiarity coefficient is -0.02 (p=0.21) and Use coefficient is 0.08 (p=0.38).
Figure 1: (n=194) Linear regression with Leadership as predictor variable (X) and Preference as target variable (Y)
The value in being perceived as a leader
Interpreting this model, we can expect preference to increase by 0.22 for each 1% increase in leadership. However, it isn’t difficult to see how both familiarity and use affect perceived leadership. For instance, a linear regression with just Use as the input variable for our target variable, Preference, resulted in R2 of 0.89 (p<0.05) and a coefficient of 0.35 (p<0.05). When other variables are not included, Use provides a significant explanation in Preference – 89% of the variation in Preference can be explained by Use. However, when Leadership is added into the model with Use, we see the explanatory power of Use diminish.
Altogether, it’s important to build your brand and continue marketing your services to sponsors to build that leadership – the most significant predictor variable on preference. Use and familiarity explain variation in preference, as well, though their influence seems to diminish when leadership is included.
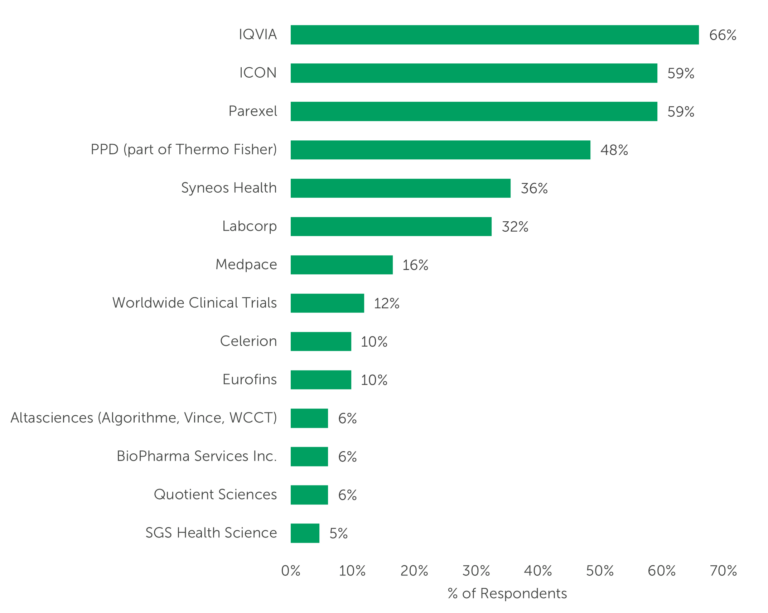
Let’s see if our data – real answers from real pharmaceutical professionals – match this. Which CROs are perceived as leaders for Phase I services in 2022? Which CROs are the preference among respondents? We see more than 50% of respondents indicating the perceived leaders as IQVIA, ICON, and Parexel. (See Figure 2).
Figure 2: “Please select the Phase I service providers you think of as leaders in the field. Select up to 5.” (n=194) NOTE: Graph displays only those with 5% or more; see Phase I CRO Benchmarking (15th edition) for full data.
Become preferred over competition
Which CROs were selected as their preference? Yes, those same three leaders topped the chart in Preference: IQVIA, Parexel, and ICON. IQVIA emerged slightly ahead of the others with 21% of respondents. The next three each received between 11% and 13% of respondents’ votes, indicating close competition for preference.
Figure 3: “Which service provider would you prefer to work with for Phase I services if the decision were completely up to you? Please disregard any preferred provider agreements, contractual arrangements, and other organizational constraints that may be considered in a typical selection scenario. Please select only one.” (n=194)
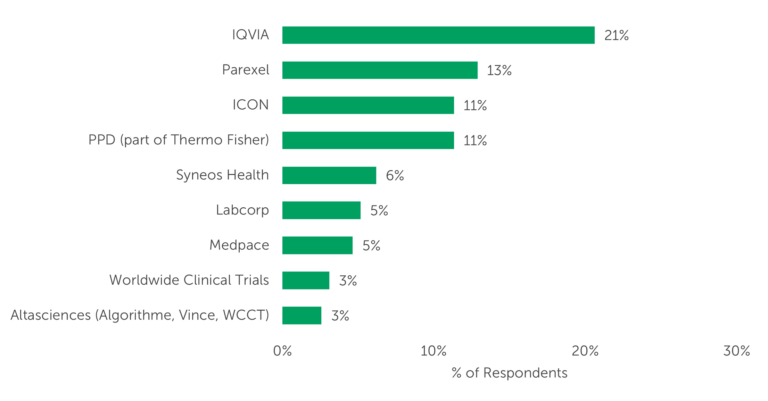
NOTE: Graph displays only those with 3% or more; see Phase I CRO Benchmarking (15th edition) for full data.
Altogether, many factors contribute to preference and to CRO selection. Leadership is seen as an important contributor to explaining preference, though familiarity, previous positive experience/use, and awareness affect both perceived leadership and preference. So, if you’re not currently seen as a leader, it’s not all bad news. There are ways you can showcase your strengths and be a leader in certain areas. Consider reviewing our report and see how recent users rate your services on a number of attributes. Having dependable data in a benchmark study may be just what you need to market your CRO well.
Primary market research data in this article were powered by the ISR Health Panel. Want to contribute to thought leadership pieces and help to make the pharma industry better? Join today.
Obtain more detail on CRO performance evaluation – as this comprises the bulk of the report – can be found in the 2023 Phase I CRO Benchmarking (15th edition).
Learn More 2023 Phase I CRO Benchmarking
1Scott, John. 2000. Rational Choice Theory, in book: “Understanding Contemporary Society: Theories of the Present” (pp.126-139), SAGE Publications Ltd
2Genco, Steve. March 2020. “Why Consumer Preferences Don’t Predict Consumer Behavior,” located at: https://bettermarketing.pub/why-consumer-preferences-dont-predict-consumer-behavior-e905834bc0ce