[account_shop_links]
Without safe and well-designed clinical trials, drug development would lack necessary direction and evaluation. The industry knows how valuable clinical trials are and so do we. Our reports explore the myriad facets of this dynamic and crucial process to provide pertinent information to organizations that rely on clinical research outcomes. For more than a decade, pharmaceutical and biotechnology professionals have shared their service provider experiences and perspectives throughout clinical trial phases I, II, and III. This information is compiled in the annual Industry Standard Research CRO Benchmarking reports.
We ask questions about preference, familiarity, awareness, and use of CROs. Respondents also rate the CROs they have used in the past 18 months on overall satisfaction, likelihood to use again, and likelihood to recommend. We hear, verbatim, their reasons for those ratings.
The relation of selection factors
The 2023 report contains responses from 194 experienced Phase I outsourcers and their insights regarding 613 recent service provider encounters on Phase I studies. Numerous factors contribute to reaching that final decision of which CRO to use for outsourcing, and we capture many of these factors in the CRO Benchmarking studies. How do these factors interrelate?
Looking at five variables – awareness, familiarity, leadership, preference, and use – we assess their correlation with one another. Correlation coefficients range from 0 to 1, with 0 meaning 0% association (or no association) and 1 meaning 100% association. In other words, awareness correlated with awareness (yes, the same thing) is 100%. Makes sense, right? The conducted correlation results in the following:
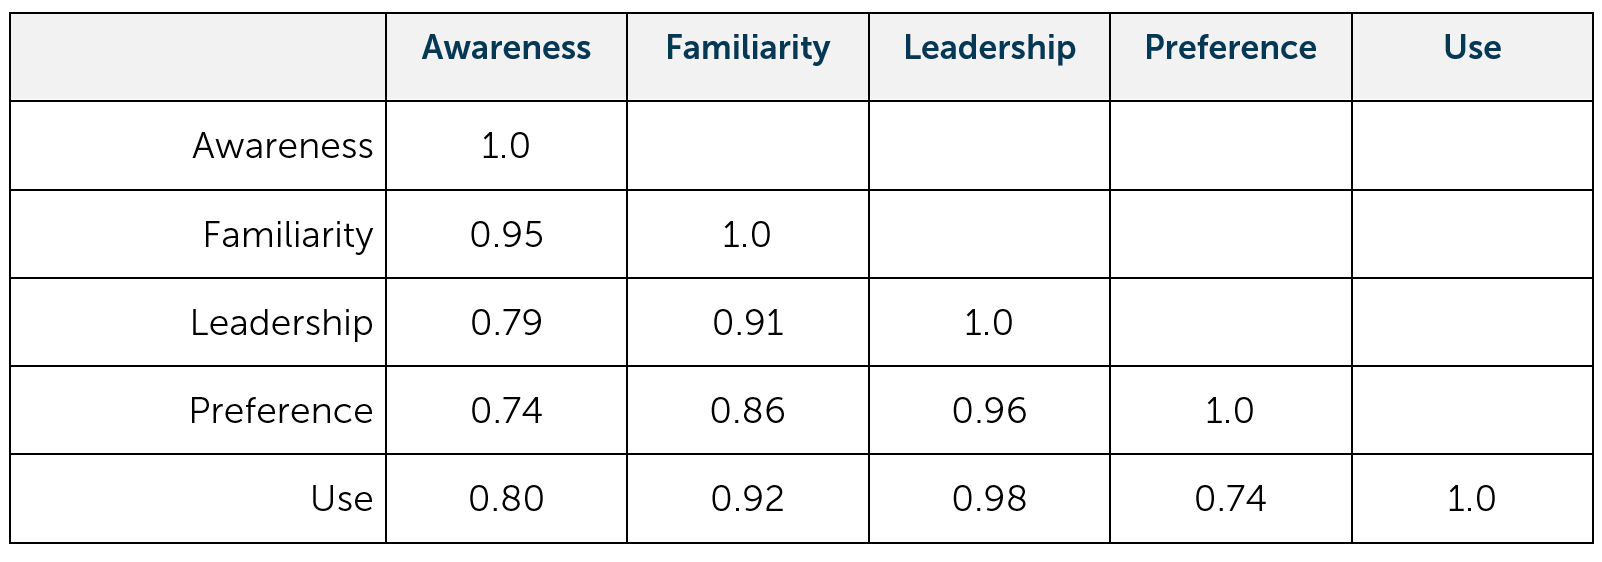
Interesting that Use and Awareness, while highly correlated with one another (correlation coefficient = 0.80), are not the variables most related to one another. The associations to note are Familiarity and Use (correlation coefficient = 0.92), Leadership and Preference (correlation coefficient = 0.96), and Leadership and Use (correlation coefficient = 0.98). Familiarity, Use, Leadership, and Preference all are interrelated – correlating with one another more than 70%. This indicates that being familiar with a CRO relates to one’s use of the CRO, their preference of CRO, and even the perceived leadership. It is worth mentioning that correlation is not causation. Association with one another does not mean one variable causes the other. Being familiar with a CRO does not cause one to use their services nor does perceived leadership cause preference. So, we are not declaring one variable causing another, but there is usefulness in knowing they are interrelated. They are all associated with one another (stay tuned for a follow-up article on regression to show the explanatory and predictive power of these variables on Preference).
Becoming the service provider people prefer
Let’s see if our data – real answers from real pharmaceutical professionals – match this. What did our respondents tell us about their use of CROs, their level of familiarity, and those CROs they see as leaders for Phase I services in 2022?
Nearly three-quarters of respondents or more were familiar with IQVIA, Parexel, ICON, PPD (part of Thermo Fisher), Labcorp, and Syneos Health, comprising a first tier. Medpace, Worldwide Clinical Trials, Eurofins, and Celerion – making up a second tier – were familiar to the majority of respondents but have significantly decreased perceived leadership and usage rates (see Figure 2). The majority of respondents selected IQVIA, Parexel, and ICON as leaders in Phase I service providers, each selected by more than 50% of respondents. Reported use within the past 18 months among these perceived leaders ranged from 34% to 46%.
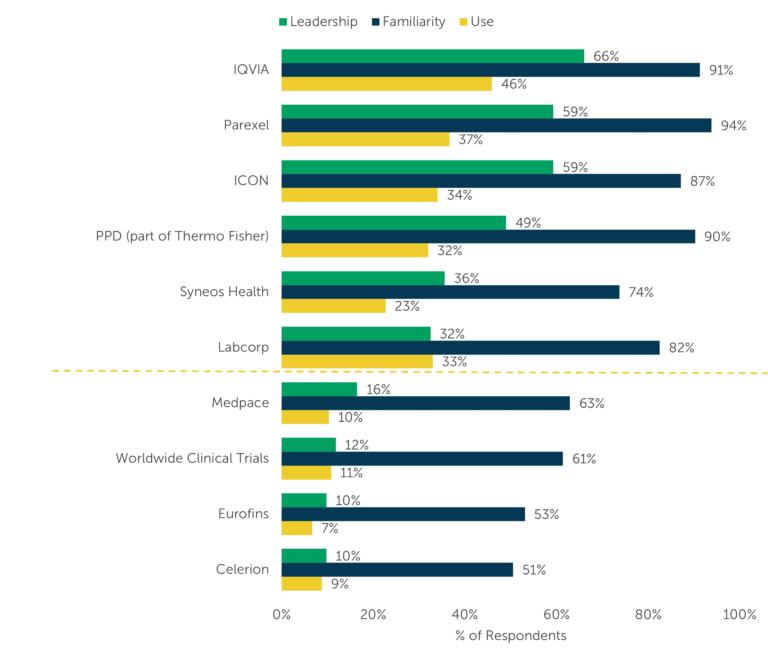
Figure 1: (n=194) “Now using the list below, please select the Phase 1 service providers you think of as leaders in the field. Select up to 5.” “Please indicate your level of familiarity with each of the following providers’ Phase I services.” Figure shows percent of respondents at least ‘somewhat familiar’ with each provider’s Phase 1 services. “Please indicate your use of each of the providers below for Phase I services.” Figure shows only CROs with higher percentage responses. See Phase I CRO Benchmarking (15th edition) for all providers.
Understanding the relation between awareness, familiarity, perceived leadership, use, and preference can help you promote your CRO. Use the real experience of users to better position your company as the provider that can meet their needs and exceed customers’ expectations. Gain insight into your strengths – and weaknesses – to build your brand and improve the other areas. When outsourcing, this information can inform your final decision as to which CRO best fits your needs, whether you’re familiar with the CRO or not. ISR Benchmarking studies can provide detailed data on which CROs are leaders in a variety of areas and how each one performs on more than 20 metrics. We also offer custom market research.
More detail on CRO performance evaluation – as this comprises the bulk of the report – can be found in the 2023 Phase I CRO Benchmarking (15th edition).
Learn More 2023 Phase I CRO Benchmarking
1Scott, John. 2000. Rational Choice Theory, in book: “Understanding Contemporary Society: Theories of the Present” (pp.126-139), SAGE Publications Ltd
2Genco, Steve. March 2020. “Why Consumer Preferences Don’t Predict Consumer Behavior,” located at: https://bettermarketing.pub/why-consumer-preferences-dont-predict-consumer-behavior-e905834bc0ce